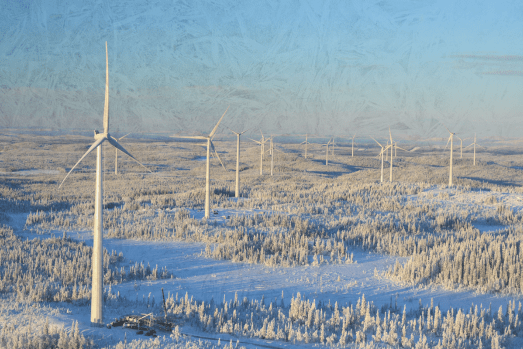
Will the potential for 50% CO2 reduction from electrification with wind power be physically possible for the oil/gas industry?
Wind power as decarbonization means for the oil and gas industry and the related challenges, one of which is the viability of offshore wind in production – findings based on studies and simulations for two decarbonizing projects done by ConWX.
There is no doubt that wind power will be a substantial part of the electrification of the oil and gas industry, however, not all wind power produced can be integrated into the power management system for decarbonization. We are still facing a relatively high rate of curtailment and usage of gas turbines.
It is important to have a clear picture on the predictability of power forecasts that will be used in the power management system. At ConWX found that a more conservative forecasting approach, than normal nomination, needs to be applied to provide the oil/gas rig with power on a continuous basis.
ConWX has recently performed backtest analysis for two oil electrification projects and we have valuable results from those studies, where historical measurements were used for the simulation of trained historical power forecasts for each individual rig location.
The biggest surprise for our clients is the power fluctuation pattern for offshore wind turbines placed in the North Sea.
In the analysis, we simulate the value and the size of energy storage and its influence on the energy mix, including gas turbine, wind power, and battery.
Any management system needs an uncertainty indicator on the very short term. We present situations where the coming wind power production is too unpredictable to be used for such a management system with the consequence that gas turbines must be running regardless of any wind power production.
Our simulation calculates the saved CO2 emissions in two different electrification scenarios – one with a combined system using wind power, storage, and gas turbines and the other using only wind power.
Let me start on a personal note – it took me less than a week to have +50 new Linkedin connections and at least 10 meetings booked – ALL thanks to one little buzz word – PPA.
It seems like it’s what everybody wants to speak about in the (renewable) energy market. There seems to be a lot of power in the acronym PPA, that stands for Power Purchase Agreement.
As part of my little experiment, I even added the acronym to the headline in my Linkedin profile. It worked!
What is a PPA?
And how can you limit some of its in-built risks?
Did you know that already back in 2017 Google achieved their 100% green electricity goal, sourcing all their energy (appr. 3GW) through a green corporate PPA?
Now, wouldn’t we all like to be like Google – securing electricity supply to our business and saving the planet at the same time?
A (green/renewable) PPA is a very important agreement that regulates the sale and purchase of power between the renewable energy producer (clean energy producer) and the energy user (clean energy buyer). PPA is crucial to the bankability of the project – basically, if you need funding for your wind or solar project – then you better have one in place.
So, yes! – renewable Power Purchase Agreements help deliver MORE renewable energy to the grid, hence saving thousands of tons of CO2. You and your company CAN make a difference and shape the renewable future signing a PPA with a wind or solar energy generator.
Virtual, physical, corporate, sleeved, off-site, aggregated, long (e.g. 30 years) vs. shorter-term (e.g. 10 years), wind or PV park availability guarantee, curtailment, ‘buyers’ market’, subsidies ….
– all of the above vocabulary is being used to further define the PPA type in question, both from a legal perspective, as well as in terms of the physical conditions that the agreement will be based on.
It is not the goal of this article to discuss each term, but rather to emphasize, that they all have ONE thing in common – the RISK(s).
When drafting a PPA agreement, it is the responsibility of the energy generator to provide your business with as much financial certainty, during your PPA with them, as possible. We have tried to digest all the potential PPA risks into the following 3 questions:
1. How will the market evolve over the time of my PPA agreement?
2. How will the energy prices develop?
3. What about the production/energy output?
– after all we are dealing with entirely weather-dependent energy sources?
Now, we would highly recommend you discussing the market and energy prices (question no. 1 and 2) with relevant experts.
What we’ve decided to focus on what we are best at (tadaam!) and what we’ve been helping the energy sector with for more than 10 years – is the DATA. Hang on for an answer to question no. 3 and learn how we can help you minimize the risks related to weather and hence to the expected production output of any given wind or solar park and portfolio.
The truth is that, at ConWX, we receive numerous requests on a weekly basis from energy companies, energy trading companies and developers, eager to understand the impact a new wind or solar park will have on their existing portfolio.
Will the new assets minimize or add to their current balancing risk?
What influence will the new wind or solar park have on yearly production variability?
Will it contribute to the diversification of the portfolio?
So, we’ve decided to make answers to these questions available online, as part of ConWX’ latest product development – the Portfolio Analyzer.
The Portfolio Analyzer
If you are dealing with multiple PPA analysis and a large variety of wind & solar parks and portfolios – then ConWX Portfolio Analyzer may be the right solution for you.
ConWX Portfolio Analyzer
You can easily simulate hourly productions for the last 20 years – based on high resolution weather hindcast data and empirical power curves for a wide selection of production units.
You can also download all the 20 years of power and weather data in hourly resolution – for the specific location and technical specifications of the park. You can then compare this data to the historical production data that you may have been provided with and hence calculate the MW/imbalance error – crucial in understanding your PPA risks.
Calculations can be carried out on individual assets, as well as on portfolios, and production is given as hourly and average load factors.
Yearly load production in hourly resolution
ConWX Portfolio Analyzer in brief:
Perfect tool to assess PPA risks
Besides yearly production factors, you can also download 20 years of data in hourly resolution and do a projection for the future
Since you really don’t know what happens with the market and energy prices in 5 years – what you CAN minimize is the weather and hence production related risk
Companies like Statkraft and Equinor have been happy users of ConWX Portfolio Analyzer.
If you’ve reached so far, reading this article, do yourself a favor and take 1 more minute of your time to watch this little appetizer video, we’ve made especially for you:
Now, if you only have a limited number of PPA’s or other changes to your portfolio during the year, then ourad hoc park and portfolio analysismay be the solution you want to have a closer look at. What we do for energy and energy trading companies, but also PPA Platforms, like e.g. Pexapark, is a reanalysis or backtest, where we set up the new park(s) as if we were to make power forecasts for it.
Just like with ConWX Portfolio Analyzer, you are provided with a data series covering the realised production. This is where we use our historical forecast data. This analysis only gets better if you do have historical production data that we can then use to fine-tune our models and to choose correct weights for your specific park, group of parks or a portfolio. Again, having historical production and our backtest makes it possible to calculate the MW error.
The information that we typically get from our customers, ahead of the backtest/reanalysis is: plant location, capacity, hub height, etc. + historical observations.
RISKS are an inevitable part of the renewable PPA agreements – now and in the future. Equip yourself with tools that will help you minimize risks for you and your customers.
As solar power technology gets cheaper and cheaper, it also gets more and more affordable, which means that not only private homes, but also large-scale utilities are shifting to solar power. And with the overall state of our mother Earth and our precious climate, the switch from conventional to renewable energy sources, especially solar ones, has accelerated significantly.
Now, it most probably does not come to you as a surprise, that solar power needs sun to do any good. There is in fact a direct linear correlation between the amount of sun rays (radiation) reaching a solar panel and the energy that this very solar panel produces.
Solar radiation is however not the same as temperature, which is why you will find plenty of large-scale solar power parks, as well as consumer-scale house solar panels, in the colder areas on earth, e.g. Northern Europe. As long as the clouds do not stand in the way, your solar panels will keep on producing electricity, even in wintertime – if they’re snow-free. And even with clouds above our heads, solar panels, depending on their type, will still produce approx. 10-25% of their nominal (maximum) power output.
Now, is there anything that affects solar radiation?
Yes, there is! Besides the cloud coverage, solar radiation depends on the time of the day and time of the year (both indicating where the sun is located on the sky, at what angle it hits your solar panel and whether or not anything, such as a building, mountain or tree is casting a shadow on it) – so the more clouds or shadow the more limited solar radiation; early morning and late afternoon hours mean also smaller energy production and finally, the more up north you are the lower the position of the sun during winter months in the northern hemisphere, hence again the more limited energy output.
Add to this sand being blown from dessert areas, like for instance Sahara sand, which, on rare occasions, affects solar energy production in Europe and can decrease the power output with e.g. 10% in Germany.
What about the temperature?
Well, extremely high temperatures, like the ones we’ve seen in e.g.: the state of Minnesota (US) and in many parts of Southern and Central Europe back in July 2019, decrease the efficiency of solar panels and hence also the amount of electrical energy produced. This has to do with the physics of what is going on in a solar panel.
Without going into details, as each solar panel manufacturer may have a slightly different technical specification for their panels, solar panel efficiency, i.e. the percentage of the solar energy that can actually be converted into electricity, decreases with temperature increase. Typical testing temperature for solar modules is 25°C / 77°F.
Bear in mind that it’s the temperature of the panel and not the ambient one. Temperatures higher than this can reduce output efficiency by 10-25%. Now, add this the fact that, when the ambient temperature is for example 25°C, on a sunny day, this can easily mean 40-45°C on the solar panel itself – which is again what matters when we speak about efficiencies.
What does this mean for the future of solar energy?
With global temperatures constantly rising – what effect will this have on the development of solar power around the world? Any thoughts?
Will a further, drastic drop in production costs of solar panels counter-balance the potentially lower efficiency, due to higher ambient temperature?
No matter what, the GOOD NEWS is that there are ways to make a fairly precise analysis of historical power production from a given solar panel type in a given geographical location. This analysis will answer the question of what your new solar farm would have produced if it was already in operation in the past.
Equally, a similar analysis of the future power production, that you can expect from the solar panel, is also possible. Both are available at ConWX and both will give you a very good picture of what to expect from your solar farm – during a heat wave, in colder winter months, with blue skies or heavy rain clouds. With access to multiple, high resolution Numerical Weather Prediction (NWP) models, ConWX data specialists, meteorologists and mathematicians have mastered the understanding of big weather, wind and solar data.
Who’s not interested in knowing exactly how the weather will be – when you’re planning on seeing your favorite football team play, going for a hike in the woods, booking a beach holiday, or trying to teach your kid how to fly a kite?
The same curiosity, combined with the need of risk mitigation and profit optimization applies for energy traders, renewable energy developers, energy companies and utilities.
In the previous article (part 1) we have already covered the ‘why,’ i.e. the reason why good, reliable wind and solar power production forecasts are necessary.
Let’s focus now on the ‘HOW’, i.e. ways of fine-tuning and constantly refining the inputs and the outputs of the wind or solar power energy generation formula.
A typical short-term(*) power production forecasting approach covers the following input information:
Wind or solar farm location
Installed capacity of the farm
Historical data from the farm:
production data – at least one year, but preferably as much as available (unless, of course the farm is brand new)
local weather measurements from a met-mast or a measurement tower (if ever installed)
(*) Short-term is typically defined as intra-day (today), day-ahead (tomorrow), and up to 7 or sometimes 10 days.
To sum up, we need as much information as possible about the wind or solar farm itself – as a minimum, a typical forecasting company, like e.g. ConWX, will need to know the installed capacity and the geographical location (latitude and longitude) of the farm.
The next step is adding the weather element to the equation. The de facto industry standard is to use weather data input from a Numerical Weather Prediction (NWP) model. Now, each model on the market behaves slightly differently – one may be better during summer, one may be better at predicting weather in difficult topography terrains, while yet another one … well, would be completely useless.
For the specific site(s), the same model can also be very good at one location but at the same time bad at a neighboring location
Weather models also come in different resolutions. The higher the resolution, the smaller the grid cell and the easier it is to get precise weather information about the location of your specific farm.
So, as you can imagine, if you pick the wrong weather model, you will get very inaccurate forecasts. What a good forecasting company then does is that they use multiple NWP models and decide on a relevant mix. What this means is that they are taking the best weather data and the physics of the model and apply it to your farm in a weighted manner – e.g. 40% from the main and most reliable model, 30% from the secondary model, and 20% from the 3rd model.
The ranking of the models does not necessarily depend only on absolute accuracy but also on what they bring to the table, i.e. whether they add new information and hence value to the model mix – there is no benefit in adding more of the same.
An experienced wind and solar power forecasting company will have access to multiple weather models. Typical global NWP models that are in use in the energy market are:
The European ECMWF model
The American GFS model
The UK UKMO model
Some, like ConWX, will also have their own meso scale (i.e. high resolution) models available.
So, data input number 2 is the weather and multiple weather data inputs result in 15-20% more accurate forecasts.
Simple versus High-quality forecasts
This is where average forecasting companies stop their quest.
Only the most experienced ones, with huge customer bases, will have enough big data to work on and implement additional ways of improving the very short-term forecasts – typically defined as the intra-hour (within the next hour and up to 6 hours ahead).
Also, only the most knowledgeable forecasting companies will apply AI and machine learning techniques to constantly learn from the big data and teach their forecasting algorithms.
It’s important to emphasize here that you should only trust a forecasting supplier that can guarantee a ‘Chinese wall’/a sealed no-access border between YOUR data and the data of all their other customers. After all, you wouldn’t like your competitor to benefit from your own data.
How to improve short-term forecasts
Let’s have a look at what other improvements of a short-term forecast can be expected from a forecasting company like ConWX:
(1) The most common add-on is using real-time production data from the wind or solar park to further fine-tune the next 6 hours of the intra-day forecast. A typical improvement that you can expect is 30-50% (YES! That much!). These corrections are often referred to as PERSISTENCE. If the client has access to high-frequency production data that they can share with their forecasting provider every 5 or 10 minutes, then an additional improvement of 5-10% can be achieved.
How to imrove short-term wind and solar power production forecasts
(2) What if you could use farms in your own portfolio to detect weather changes that will affect the rest of the portfolio downstream? Depending on how the climatic front moves – i.e. depending on how the wind blows – changes observed in one or a group of farms can be used to further fine-tune the very short-term forecasts on other neighboring farms. If an improvement of 25% on 8% of the worst events is not impressive, then I don’t know what is!
It’s obviously given that all of the farms must belong to the same customer of ours (alternatively a consortium of energy companies) – as mentioned above, at ConWX, we would never share data between our customers.
(3) Offshore wind is increasingly gaining momentum in most parts of the world. Finding targeted solutions that can help increase the quality of short-term power production forecasts in the offshore environment is therefore crucial. At ConWX, we have been able to reach an improvement of 13% over the first 20 minutes of the intra-day forecasts utilizing readings from 1 to 2 LiDARs located on the perimeter of a typically large offshore park. LiDARs can, as a matter of fact, be utilized onshore as well.
Further improvements of short-term power production forecasts
(4) In areas with an extremely high concentration of wind energy sources, such as e.g. Germany or the Netherlands – curtailment (or Einsmann in German) is what everybody fears. Curtailment can however be forecasted as well. And by curtailment, we mean here the actions taken by the grid operator to balance the grid by cutting off chosen wind parks. At ConWX, we have developed a method that results in 5-8% improvement of the intra-day forecast.
Curtailment forecasting example
(5) Yet another important parameter that a good forecasting company will need to take into account is icing. It comes in different forms and not all the icing can be forecasted based on the data available in the NWP models. Do yourself a favor and help your forecasting company with data input to the following questions:
Are there any real-time observations (ice, temperature, humidity)?
Is there heating in the blades, and how is it being operated?
What is the response time?
Can heating be started automatically?
Icing and power forecasting
A very crucial element of a reliable forecasting service is constant performance monitoring of the quality and accuracy of the forecasts; especially in difficult ramp situations.
The common denominator for all of the above-mentioned possibilities of improving and fine-tuning a short-term wind and solar power production forecast is data. You can never go wrong with sharing the data and you can never provide your forecasting company with too much data. As you can probably guess, close and trust-based cooperation between an energy company (/utility/energy trading company) AND the forecasting company is the CORE of being able to generate the highest possible production forecasts.
Remark: the part that we anticipate a good forecasting company is taking into account while generating wind and solar power production forecasts is farm availability – meaning the times when the farm is actually available to produce energy and there is no service or maintenance being done; plus various types of shut-downs, such as e.g. shut-downs due to too strong winds to prevent turbine overload and noise, as well as visual and environmental curtailments.
Wind and solar energy sources are entirely dependent on weather. Full stop. Mastering the ability to forecast the weather and hence the energy produced by wind and solar energy sources is the most important task that energy traders, renewable energy developers, energy companies, and utilities are facing today. Their raison d’etre, financial results, and everyday operational tasks highly rely on accurate power production forecasts.
Running any kind of business implies taking calculated chances, reducing risks and managing variabilities. Risk taking is practically built in energy trading of power generated from wind and solar energy sources, incl. those located behind the meter (BTM). Whether you are a renewable energy developer, an energy company with a mix of conventional and renewable assets or a utility, managing what gets on the grid and what gets off the grid – all have a need for the most precise information and the highest quality power production forecasts.
The good news is that it is possible to foresee how big of a risk you may be running with relatively high accuracy.
Before we dig into ways of designing and implementing the perfect wind and solar power production forecasting set-up, let’s take a look at the type of risks coming from wind and solar resources that energy companies and utilities – or any other company directly involved in production, distribution and trading of energy – are facing.
Wind and solar energy production, trading, balancing and overall management is typically connected with one or often multiple set of risks, such as:
Large scale production fluctuations – this can cover year to year changes in wind and solar radiation, but also climatic impact and climate changes.
Large variation in predictability – highly dependent on where on the globe your farm is located. Is it less complex, rather flat terrain in, incl. offshore in general, or demanding and thermal driven areas?
Plant outages (non-scheduled) – cut-offs and grid-operator-forced curtailments
Weather related outages (storm, icing, snow and desert sand)
Surplus production – when we have been surprised by our forecasts and the actual production has in fact been higher and we now have to deal with surplus energy
i. Higher balancing costs
ii. Low or negative prices
Similar consequences apply in case of production deficiency
Penalties – 90% of costs are distributed over 10% of the time
Ramp events – i.e. sudden, unforeseen drops or increases in especially wind power generation – problematic both for those balancing the Bulk Power System or the grid (TSO/ISO/RTO) and those who trade
Thermal effects (coastline or mountain area)
Finally, there is also the risk of not knowing and hence not being able to act upon what others are doing on the market/grid.
Now, as we take a closer look at the above list of risk factors, we quickly discover that many of them are weather and weather-and-terrain related. Why is this important? Well, here comes the formula transforming the wind speed into the actual power produced by a wind turbine.
Any motion of wind has an available kinetic energy, which is given by the following equation:
To calculate the actual power a wind turbine produces, we also have to take the power coefficient (Cp) into account, which is the percentage of extracted power of kinetic energy to mechanical energy: Cp = Output/Input = Pturbine/Pwind
Which of the unknowns do you think are the most unpredictable?
– take a wild guess!
Yes! You got it right! – It’s the wind speed or the velocity! Now add to this the wind direction, air stability, all seasoned with machine learning and you come close to predicting the power generation from your wind turbine.
So, taming the weather and minimizing the uncertainty and inaccuracy of weather input to the above formula is the main job of anybody dealing with wind and solar power production forecasts.
Now that we have established the why, let’s continue to the how – how can energy companies ensure high quality and hence high accuracy of power production forecasts for their wind and solar assets in practice? We’ll cover this in Part 2 of this article.
Wind and solar energy sources are entirely dependent on weather. Full stop. Mastering the ability to forecast the weather and hence the energy produced by wind and solar energy sources is the most important task that energy traders, renewable energy developers, energy companies and utilities are facing today. Their raison d’etre, financial results and everyday operational tasks highly rely on accurate power production forecasts.
Data is at the core of our business at ConWX, and we know that the quality of input data is reflected in the accuracy of our forecasts. That is why cleaning data is the first step to ensure we have the best input data for training our models. Data cleaning helps us diagnose issues such as outliers, missing values, and noisy data, which all affect data quality.
Some estimate that data scientists spend 80% of their time cleaning and manipulating data, and less than 20% analysing it. In our experience, the ratio is not that dire, but truth be told, data cleaning is a big part of our work at ConWX.
Taking the amount of time used on cleaning data, we have made a few guidelines on, how to make data cleaning as smooth and easy as possible.
Advice on data cleaning from our data scientists
Use the tool that makes sense. It’s essential to have a wide range of tools available as there is no one-tool-fix-all. Whether it’s Python or Excel, there are pros and cons for each tool for the task at hand. Before deciding on the tool, ask yourself, how fast does it need to be done, can the logical pattern for cleaning the data be easily implemented in the tool, is it a recurring task, what is the tool you are most comfortable with. You will likely end up using different tools for different steps in the cleaning of data.
Correct data if you have enough information. Use all available features to make the most out of the dataset. Say you have a power production time series for a wind park where the maximum production changes over time. If you also have the turbine availability and potential curtailment, you can use that to scale the power to 100% availability, and use the scaled data to train your models.
Less is more. Sometimes you are better off eliminating data that deviates from the standard or simply looks odd. Having said that, be sure not to eliminate too much noise from the data as this might end up mispresenting the true nature of your data.
Communicate with the source. Do not be afraid to contact the source of the data and ask for more information. It can save you from making wrong assumptions or simply discarding good data.
Well, an accurate weather forecast is the first step to generate a good power production forecast. To have the most precise weather forecast, several weather models (NWP), are often used in a combination as one forecast calculation model might work best at high temperatures, while another in a certain region when winds are strong.
The country and region determine the combination of models. Let us take Scotland for instance that has a complex terrain. The model mix here, are most likely different from the models used to determine power generation for a power plant located in a flat terrain, in Denmark. So, weather models and the combination of models are important for precise prediction.
Yet, other elements are also of significance. Measurement data, location data and generation capacity from the power plant is an important component to predict future power generation in a given area.
Here, the accuracy of the (historical) production data determine the precision of the power production forecasts. Information on data resolution, plant availability and potential curtailment also contributes to increase the forecast accuracy.
Not to mention, metadata from individual turbines, which help determine any differences in power production on individual turbines, which again affect the entire power plant production.
So, data amount and accuracy, provide the basis to generate a good power production forecast!
Interested in knowing, how we will predict power generation for your power plant? Then, contact us for more information or read more about our power production forecasts here.
At ConWX, we understand the importance of a highly accurate power forecast for our customers and their businesses. We are continuously looking for ways to develop our forecasts in order to provide the best quality at all times.
Our most recent quality improvement to ConWX wind power forecasting system, has been achieved using a new model combination approach. As a result, we have been able to increase forecast performance with a bias improvement of 67%. By lowering bias between the forecast and the production data, our customers will have a better basis for planning production, balancing and trading smarter.
Interested in knowing more about our wind power forecasts, contact us.
This website uses cookies so that we can provide you with the best user experience possible. Cookie information is stored in your browser and performs functions such as recognising you when you return to our website and helping our team to understand which sections of the website you find most interesting and useful.
Strictly Necessary Cookies
Strictly Necessary Cookie should be enabled at all times so that we can save your preferences for cookie settings.
If you disable this cookie, we will not be able to save your preferences. This means that every time you visit this website you will need to enable or disable cookies again.
3rd Party Cookies
This website uses Google Analytics to collect anonymous information such as the number of visitors to the site, and the most popular pages.
Keeping this cookie enabled helps us to improve our website.
Please enable Strictly Necessary Cookies first so that we can save your preferences!
Additional Cookies
This website uses the following additional cookies:
Activecampaign
Please enable Strictly Necessary Cookies first so that we can save your preferences!