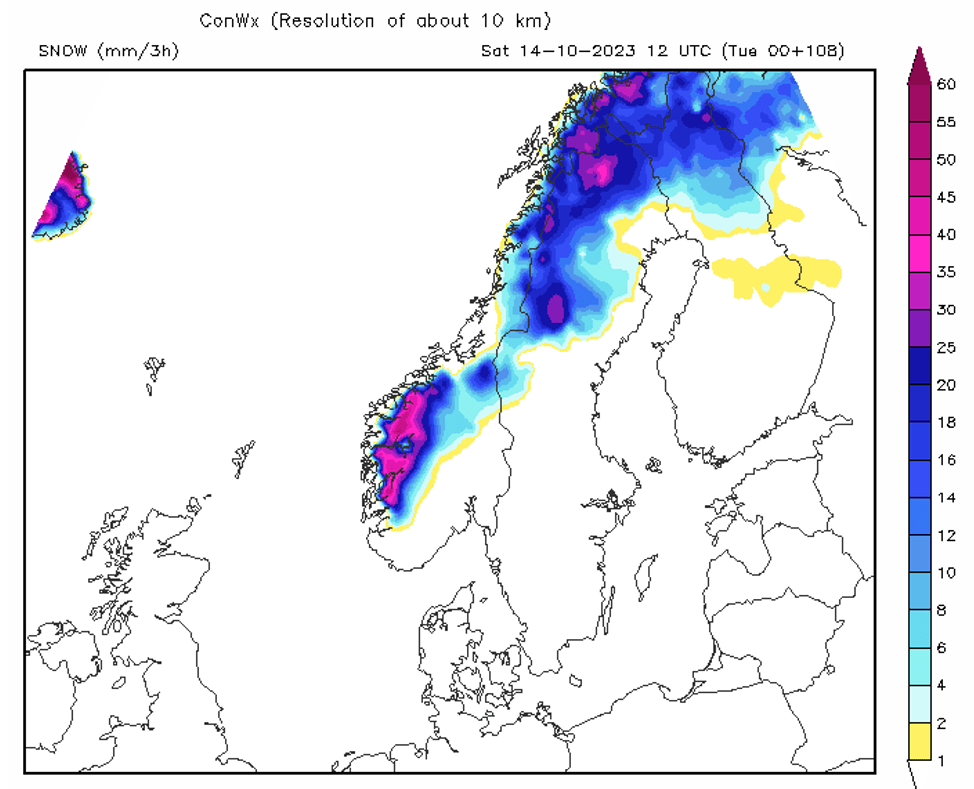
It is the beginning of October and icing season for areas with cold climates has begun. For this week NWP models are forecasting snow depth rising to 35 cm in Norway and Sweden, with a higher chance of possible icing events.
Icing is a significant weather phenomenon that can have far-reaching impacts, especially in cold climate regions. Icing occurs when supercooled water droplets freeze on contact with surfaces, such as aircraft, power lines, or roads, creating a layer of ice. In cold climate zones, this natural occurrence poses unique challenges and risks that demand careful monitoring and mitigation strategies.
That is why we at ConWX worked on the developing icing model, which will help in making decisions during icing events.
How to predict icing events without ML models?
Nowadays various ML models are used in the industry for predicting icing events and ice losses. To be able to use ML models we need data to train the models, but not all wind farms have metering data that will provide valuable information for training ML models for icing. In some cases this type of data is available but they are not consistent or somehow damaged, which sometimes may lead to misleading conclusions regarding icing.
How can we resolve these issues?
The answer is by using a physical model for predicting icing events.
Our team of meteorologists, data scientists, and engineers at ConWX have created a physical icing model, which uses data from our in-house numerical weather prediction model as a base for final output.
The physical model consists of:
Combining all these expressions different types of icing are incorporated in the model and the final output in binary result (0 for no icing event and 1 for icing events).
How do we validate the physical model for icing?
By analyzing data gathered from the sites where wind parks are located and comparing it with output from the model using different assessment metrics such as confusion matrix, recall, precision, accuracy, and F1 score, we were able to improve our original version of the physical icing model.
The final result of the analysis showed a decreased number of false negative results (a situation where the original model did not predict icing events, while in reality ice event was present) with an upgraded version of the physical model. Both model accuracy, recall, and F1 score have been improved.

When to use a physical model for forecasting icing events?
As mentioned at the beginning, icing in cold climates is a natural occurrence that requires proactive measures to mitigate its risks. By staying informed, and implementing preventive measures, people in these regions can better cope with the challenges posed by icing, ensuring safety and minimizing disruptions during the winter months.
Do you own or operate wind parks located in cold regions? Or do you seek information about power loss due to icing events? Reach out to us! We can schedule a call to talk about your specific needs.


