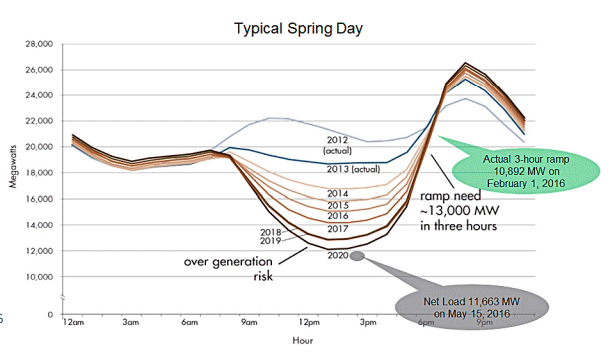
In Europe, we are witnessing an encouraging trend: a year-on-year increase in the installation of renewable energy sources. Particularly noteworthy is solar energy, which has been surprising the energy market with high outputs right from the early days of spring. The surge in solar power typically drives prices down during midday and weekends when demand is lower than on weekdays. This phenomenon, known as the “duck curve“—previously observed in California—is now becoming a daily event in European countries like the Netherlands and Spain.
The expected exponential growth in wind power capacity, particularly offshore, remains on the horizon. However, political hesitations and rising costs have been delaying the installation of these offshore wind projects. Despite these challenges, wind power continues to be the primary driver of renewable energy production across Europe.
With the rise in renewable installations, we are also seeing increasing volatility in power prices, which fluctuate hour by hour. These price spikes can be costly for physical traders in the market.
Weather model data
It’s widely recognized that production forecasts rely heavily on weather model data (numerical weather predictions, or NWP). These models are surprisingly accurate for short-term forecasts. For instance, when was the last time a winter storm in Europe was not predicted 3-6 days in advance? Not in this decade. These physical models, solved mathematically in grids ranging from 3-10 km, provide a very accurate overall picture. We are also seeing AI models significantly enhance the capabilities of NWP for mid-range forecasts (4-14 days). However, there are limitations to how detailed these advanced models can be, and very small-scale events (minutes and <1 km) are not perfectly modeled.
At ConWX, we are one of the few global energy forecasting service providers that run in-house NWP models. This has been our strength for more than 15 years. Having access to unique data allows us to inform our clients when there is a risk of failure in power production forecasts.
In the power market, the most challenging parameters to predict accurately are wind speed and solar radiation. For instance, the variability of cloud formations on a sunny day leads to rapid local changes that an NWP cannot perfectly predict.
When it comes to wind power production, many are familiar with the power curve and the NMAE (normalized mean absolute error) in NWP’s of about 1.5 m/s in Northern Europe for the next day. A small error in the forecast on the steep part of the curve can easily lead to a 30% error in energy forecasts.
ConWX weather model data mix
To address these challenges, we combine different weather models and use the best ones available for day-ahead and intraday markets, employing advanced machine learning and AI techniques. It is also well known that the best NWP model is the ECMWF, which the energy market closely relies on. Any errors or large changes in this model lead to high volatility, affecting both the physical and financial energy markets.
Throughout the year, we’ve observed the following day-ahead normalized mean errors (NMAE) for a 250 MW wind portfolio:
– NWP 1: 10.2%
– ConWX In-house NWP 2 (IRIE_GFS): 10.3%
– ConWX In-house NWP (IRIE_EC) 3: 9.9%
– ECMWF: 9.7%
– Mix: 9.4%
This mix provides the best day-ahead and intraday forecasts on average but doesn’t always signal when forecasts might go off track. Our ongoing work with clients now allows us to alert them when there is a high risk of deviations in the primary model, which could pose risks to the physical market.
Uncertainty flagging approach
In one analysis, for a small continental portfolio of 50 MW, we found hundreds of instances over a year where our forecasts deviated by more than 10% from the best-in-class predictions, highlighting periods of potential over or underestimation of next-day power production.

These uncertainties are not evenly distributed throughout the year but occur in clusters, depending on various weather regimes. The big question, of course, is what should be done in these situations and how accurate these flagging forecasts are.
In 2024, we analyzed 40 wind farms with a total capacity of more than 1400 MW. Using a threshold of 25% potential error on the forecast, we evaluated both the risk of over and under-predictions of this portfolio and compared the analysis with realized production data.
Our uncertainty flagging for overprediction was successful 73% of the time, and for underprediction, the rate was 71%.
Nearly three out of four times, your trades will be successful by following our flags. Here’s an example in the figure below of potential overprediction from July 2023, where the ECMWF power model was out of sync with the realized production data. How often do we issue these warnings? In average for 5 hours per week.

We can never achieve 100% accuracy in forecasting, but by working to highlight when risks are present, our informed users can effectively navigate the volatile power market. For our clients who require minute-based forecasts, we utilize measurements from around the farm and identify periods of extremely low predictability in various weather regimes. All our efforts are data-driven and meticulously orchestrated by our skilled data scientists.


